As discussed in a previous article, determining a baseline value for your home before determining the actual listing price is a good practice. Another good practice is to study and understand the current market conditions before you actually decide on a final listing price.
There are several statics, rates and numbers you can look at when trying to determine the health of a specific Real Estate Market but when we price a home for sale we only consider a few. The primary statistic we want to know about as we prepare to put a home on the market is “Months Supply of Inventory” (MSI). This number indicates how long it would take to sell through all of the existing inventory. Since we are trying to price a specific property, we look at MSI as it pertains to a specific area and price niche not the entire market. MSI for the overall market is more useful when answering a question like “How’s the Real Estate Market”, not so helpful when trying to answer the questions “How much can you sell my house for”?
So, for the purpose of listing a home for sale, we want to drill into a specific area, price range and type of home. For the sake of this article let’s say we are selling a:
- 4 bedroom
- 3 bath
- 3 car garage
- 2,800 square foot
- Two-Story home
- Located in the Academy, District #20 attendance area.
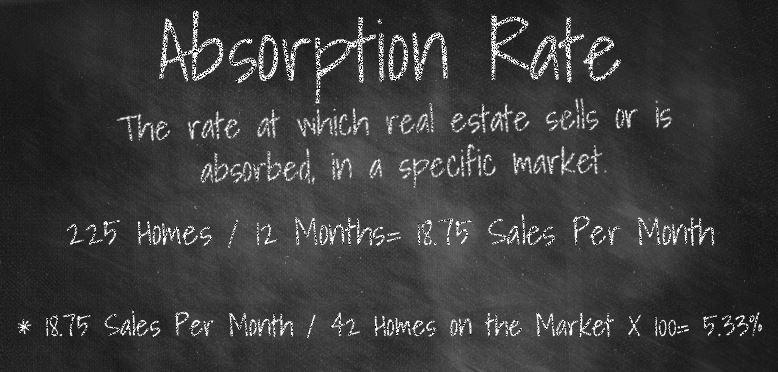
The first step to establishing the Months Supply of Inventory is to find the “Absorption Rate”. This is the number of homes that sell in a particular market segment over a specified amount of time (we use one year).
To establish absorption rate, we look at the total number of similar homes that have sold over the past year. Let’s say there have been 225 sales of this particular type of home over the past year.
This means 18.75 homes like this, sell on average each month (225 sales/12 months). If there are currently 42 homes like this for sale on the market, we have a 2.3 Month inventory of that kind of home. We determine this by dividing the number of available homes by the number that sell per month. It is important to note that Absorption Rate is often expressed as a true percentage, especially in the Commercial Real Estate world but for the purpose of establishing MSI, our method is sufficient. For the purists the actual absorption would be 5.33% of the inventory.
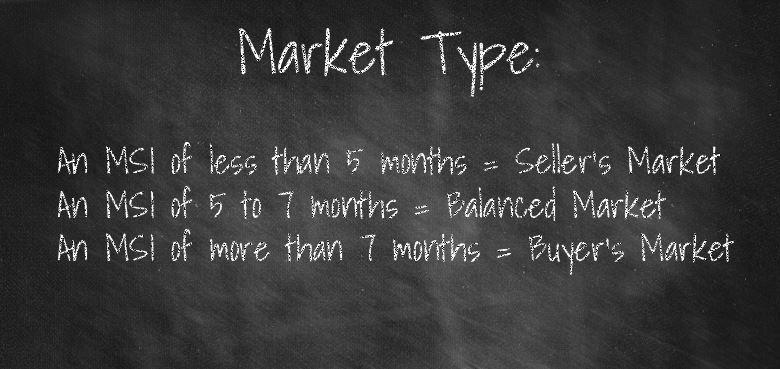
The MSI in our example ends up being 2.3 Months of inventory. This is a very low amount of inventory and constitutes a “Sellers Market”. Common acceptance of a Seller’s market is anything less than 5 Months of inventory is considered to be a Sellers Market.
- An MSI of less than 5 months = Seller’s MarketAn
- MSI of 5 to 7 months = Balanced Market
- An MSI of more than 7 months = Buyer’s Market
An MSI of 2.3 months would certainly encourage us to move higher on our listing price, although there are still a handful of other factors we look at, like: “Days on Market”, “List to Sold Percentage” as well as trends in the appraisal industry.
Months Supply of Inventory is an essential indicator to know and understand whether buying or selling.